Home
George Symonds
Through Public Government Databases As Infrastructure
In this page, I will be investigating the use of governmental datasets as infrastructure, the power of the media, and how data can be twisted to paint institutions in a self-beneficial light in relation to the cost of living crisis.
It’s a multi-faceted topic that touches and is related lots of diferrent sectors in our world, so I had to intersectionally contextualise my data in research, looking at:
- The Cost of Living Crisis
- The Climate Crisis
- The Power of Media’s Coverage
- Social Inequality
- Technological Development
- Computational Systems
- Economic Systems
- Government Databases
- Capitalism
- Neoliberalism
The Research Database (Public for use):
Investigating & Interrogating the Cost of Living Poly-Crisis Through Data
To what extent does the government exploit data and the media to serve its own self-interests?
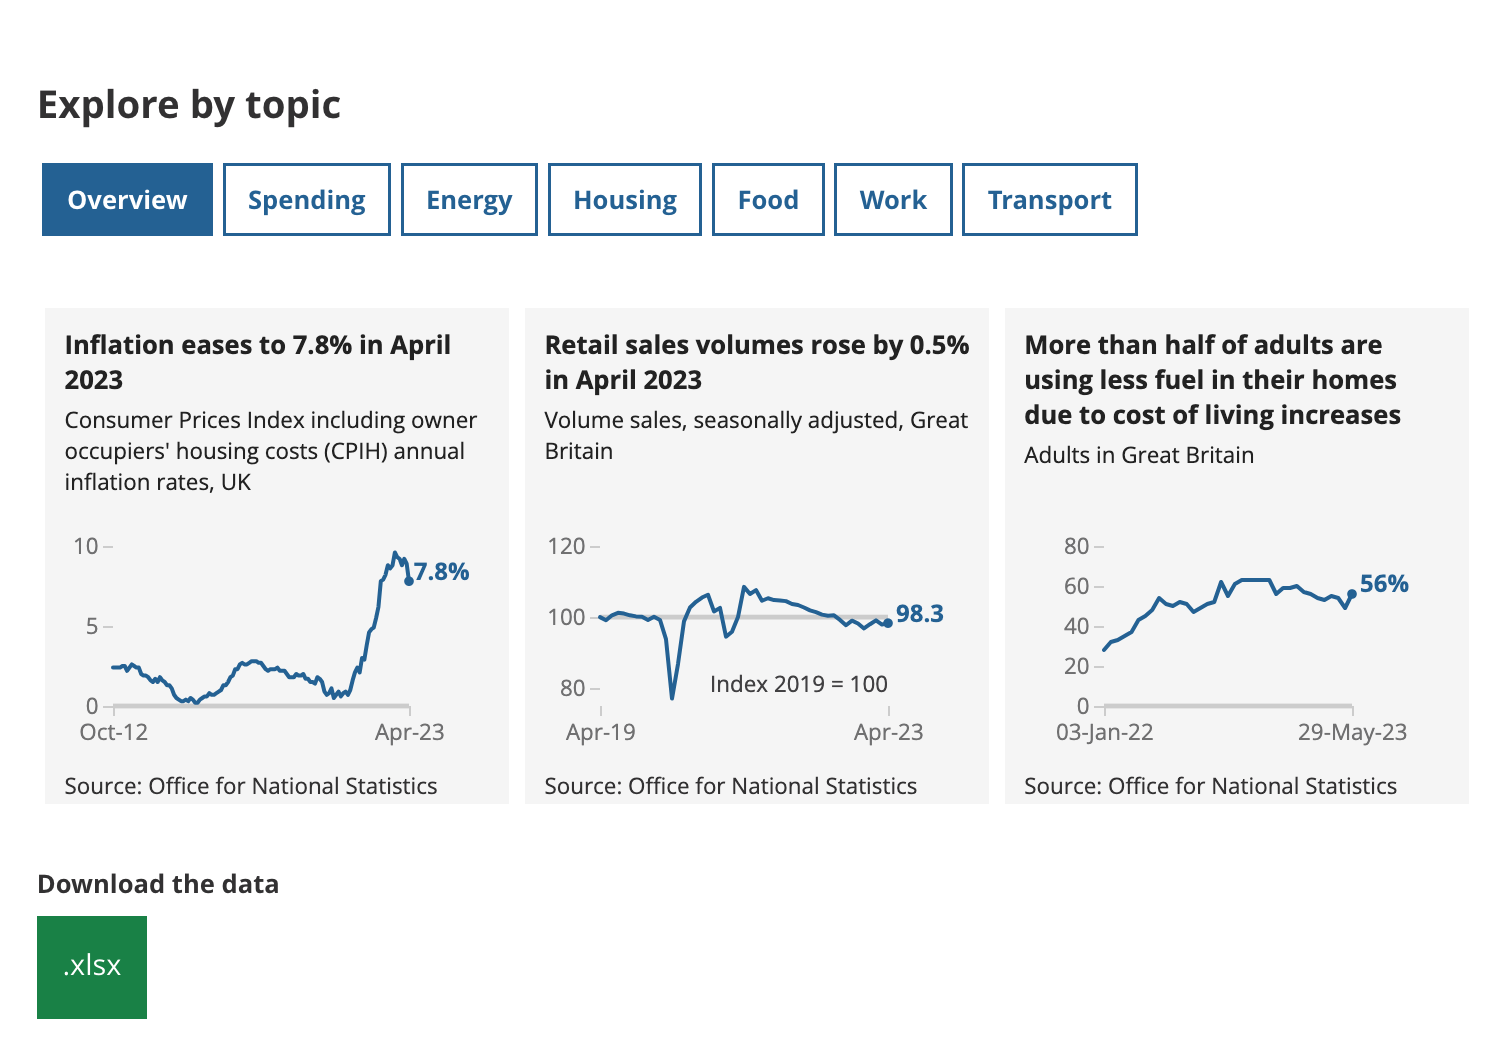
This is data obtained from ons.gov.uk regarding the inflation rate. The statement proudly proclaiming that inflation has “eased to a further 9.4% in April 2023” appears alarmingly disconnected from the actual realities of the cost of living in the UK. By focusing solely on percentage changes without providing the actual increases, the data fails to accurately represent the significant impact on individuals’ expenses. It is misleading to suggest that a 10% increase one month followed by a 9% increase the next month indicates a decrease in inflation by 1%. In reality, these successive increases amount to a staggering 19% rise over just two months. This manipulation of data obscures the true extent of the cost burden faced by individuals, and raises questions about the transparency and accuracy of the information provided.
The positive feedback loop of the cost of living crisis
As part of my public research database I’ll be creating my own original data. Specifically, I will be investigating:
The Increase of Prices in Independent Stores
Why The Increase of Prices in Independent Stores? Because the rise in their prices is often a reaction to the cost of living crisis, unlike corporate monopolies driven by profit motives.
Analysing this data will shed light on the positive feedback loop of the cost of living crises, which is a phenomena which hasn’t been discussed much and I couldnt find ay existing data on it.
The positive feedback loop of the cost-of-living crisis is a self-reinforcing cycle where rising costs perpetuate socio-economic inequalities. It impacts individuals, communities, and society, exacerbating economic vulnerability and widening existing disparities. Marginalised groups bear a disproportionate burden, facing limited access to affordable housing, healthcare, and other necessities.
Rising costs → Financial strain on individuals and communities → Limited resources → Harder to afford basic needs → Increased inequality → Disproportionate impact on marginalized groups → Limited access to essentials → Reinforcement of disparities → Escalation of the cost of living crisis
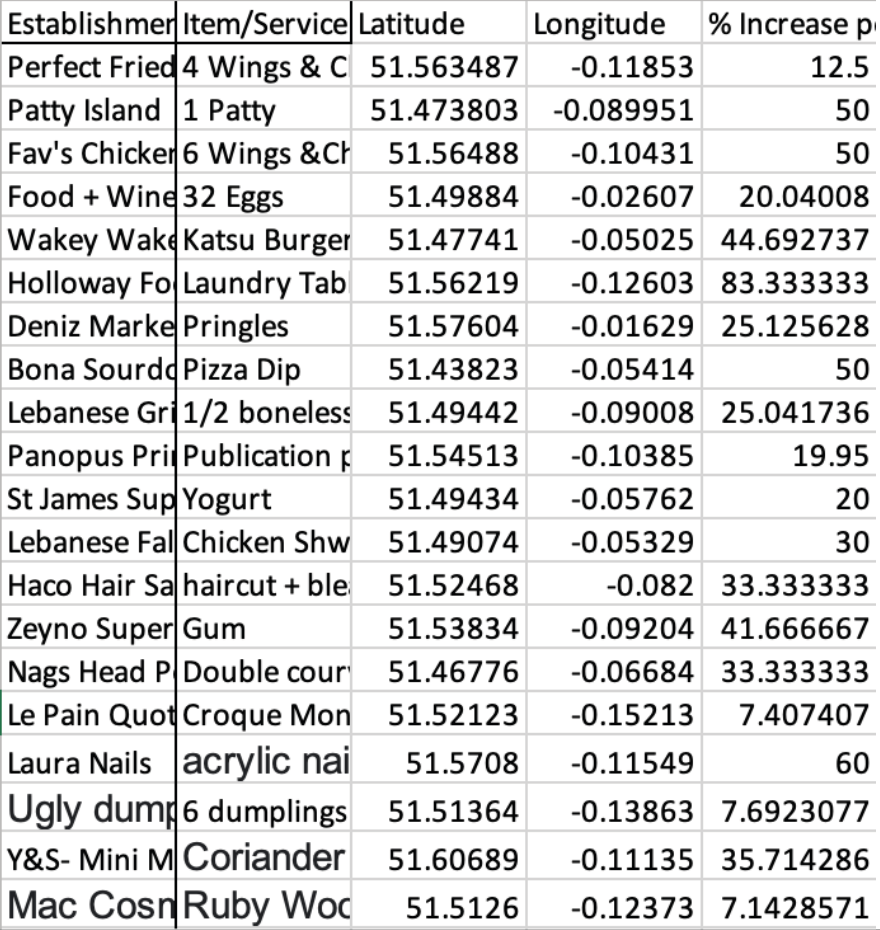
My Data On The Increase of Prices in Independent Stores:
| No | User Input | Establishment/Store | City/Town | Address | Postcode | Latitude | Longitude | Item/Service | Original Date (DD/MM/YYYY) | Year (OG YYYY) | Price (OG £) | Date (DD/MM/YYYY) | Year (Current YYYY) | Price (Current £) | % Increase | % Increase per year |
| 1 | George Symonds | Perfect Fried Chicken | London | 287 Hornsey Rd, London N19 4HN | N19 4HN | 51.5634872 | -0.1185302 | 4 Wings & Chips | 11/1/21 | 2021 | 2 | 6/4/23 | 2023 | 2.5 | 25 | 12.5 |
| 2 | George Symonds | Patty Island | London | 40 Camberwell Church St, London SE5 8QZ | SE5 8QZ | 51.4738033 | -0.0899506 | 1 Patty | 10/19/22 | 2022 | 1 | 6/5/23 | 2023 | 1.5 | 50 | 50 |
| 3 | George Symonds | Fav's Chicken and Indian Takeaway | London | 265 Seven Sisters Rd, Finsbury Park, London N4 2DE | N4 2DE | 51.56488 | -0.10431 | 6 Wings &Chips | 12/1/21 | 2021 | 2 | 6/5/23 | 2023 | 4 | 100 | 50 |
| 4 | Stanley Lucas | Big J | Jersey | Chip Butty | 7/5/20 | 2020 | 3.99 | 12/28/22 | 2023 | 4.99 | 25.06265664 | 8.354218881 | ||||
| 5 | Stanley Lucas | Food + Wine Shop | London | 54 Westferry Road, Millwall, LONDON, E14 8LW | 51.49884 | -0.02607 | 32 Eggs | 1/4/23 | 2023 | 4.99 | 5/5/23 | 2023 | 5.99 | 20.04008016 | 20.04008 | |
| 6 | Ellie | Wakey Wakey | London | New Cross Road, London | SE14 6AS | 51.47741 | -0.05025 | Katsu Burger | 8/22/22 | 2022 | 8.95 | 6/1/23 | 2023 | 12.95 | 44.69273743 | 44.69273743 |
| 7 | Louie Thompson | Holloway Food Store | London | 535 Holloway Rd, Archway, London N19 4BT, United Kingdom | N19 4BT | 51.56219 | -0.12603 | Laundry Tablets | 11/5/22 | 2022 | 3 | 6/5/23 | 2023 | 5.5 | 83.33333333 | 83.33333333 |
| 8 | Hash Rashid | Thorn Marine | Warrington | WA4 6LE | Sweet Mix Bag | 9/4/12 | 2012 | 0.5 | 6/6/23 | 2023 | 2 | 300 | 27.27272727 | |||
| 9 | Hash Rashid | Deniz Market | London | Walthamstow, bounday road | E17 | 51.57604 | -0.01629 | Pringles | 10/11/21 | 2021 | 1.99 | 6/5/23 | 2023 | 2.99 | 50.25125628 | 25.12562814 |
| 10 | Kourosh Simpkins | Bona Sourdough | London | 25 Dartmouth Road | SE23 3HN | 51.43823 | -0.05414 | Pizza Dip | 1/15/23 | 2023 | 1 | 5/12/23 | 2023 | 1.5 | 50 | 50 |
| 11 | Arturo Polizzi | Lebanese Grill | London | 173 New Kent Rd, London SE1 4AG | SE1 4AG | 51.49442 | -0.09008 | 1/2 boneless Chicken, salad & chips | 4/1/21 | 2021 | 5.99 | 6/1/23 | 2023 | 8.99 | 50.08347245 | 25.04173623 |
| 12 | Yoyo Wang | Panopus Printing PRS Ltd | London | 13 Swan Yard, London N1 1SD | N1 1SD | 51.54513 | -0.10385 | Publication printing | 03/29/2019 | 2019 | 5 | 6/5/23 | 2023 | 8.99 | 79.8 | 19.95 |
| 13 | daria cotocu | St James Supermarket london | London | 191 Southwark Park Rd., London SE16 3TX, United Kingdom | SE16 3DX | 51.49434 | -0.05762 | Yogurt | 9/1/21 | 2021 | 2 | 6/6/23 | 2023 | 2.8 | 40 | 20 |
| 14 | Inaki Ramirez | Lebanese Falafel n Grill | London | 183 Rotherhithe New Rd, London SE16 2BE, United Kingdom | SE16 2BE | 51.49074 | -0.05329 | Chicken Shwama | 4/1/22 | 2022 | 5 | 6/7/23 | 2023 | 6.5 | 30 | 30 |
| 15 | sophie gherdan | Haco Hair Salon | London | 3 Ravey Street, shoreditch, London EC2A 4Q | 51.52468 | -0.082 | haircut + bleach | 6/5/22 | 2022 | 300 | 6/5/23 | 2023 | 400 | 33.33333333 | 33.33333333 | |
| 16 | Amara Junkins | Zeyno Supermarket | London | 55 New N Rd, London N1 6JB, United Kingdom | N1 6FB | 51.53834 | -0.09204 | Gum | 8/1/22 | 2022 | 60 | 6/6/23 | 2023 | 85 | 41.66666667 | 41.66666667 |
| 17 | Kyna Jain | Nags Head Peckham | London | 231 Rye Ln, London SE15 4TP | SE15 4TP | 51.46776 | -0.06684 | Double courvoisier coke | 10/1/22 | 2022 | 4.5 | 6/7/23 | 2023 | 6 | 33.33333333 | 33.33333333 |
| 18 | Ela Kazdal | Le Pain Quotidien | London | 72-75 Marylebone High St, London | W1U 5JW | 51.52123 | -0.15213 | Croque Monsieur | 3/13/23 | 2023 | 13.5 | 6/6/23 | 2023 | 14.5 | 7.407407407 | 7.407407 |
| 19 | Aura Arif | Laura Nails | London | 34 Crouch Hill, Finsbuty Park | N4 4AU | 51.5708 | -0.11549 | acrylic nails | 7/1/22 | 2022 | 25 | 6/6/23 | 2023 | 40 | 60 | 60 |
| 20 | Aggie | Ugly dumpling | London | 1 Newburgh St, Carnaby, London W1F 7RB, United Kingdom | W1F 7RB | 51.51364 | -0.13863 | 6 dumplings | 6/6/22 | 2022 | 6.5 | 6/6/23 | 2023 | 7 | 7.692307692 | 7.692307692 |
| 21 | Kim | Y&S- Mini Market | London | 19 The Broadway, High Rd, London N22 6DS | N22 6DS | 51.60689 | -0.11135 | Coriander | 9/1/21 | 2021 | 0.7 | 6/6/23 | 2023 | 1.2 | 71.42857143 | 35.71428571 |
| 22 | Irene Liakhovenko | Mac Cosmetics | London | 27 James St London WC2E 8PA England | WC2E 8PA | 51.5126 | -0.12373 | Ruby Woo retro matte lipstick | 11/30/21 | 2021 | 17.5 | 6/6/23 | 2023 | 20 | 14.28571429 | 7.142857143 |
Contribute to this dataset Here!
How I Could Develop My Dataset Further?
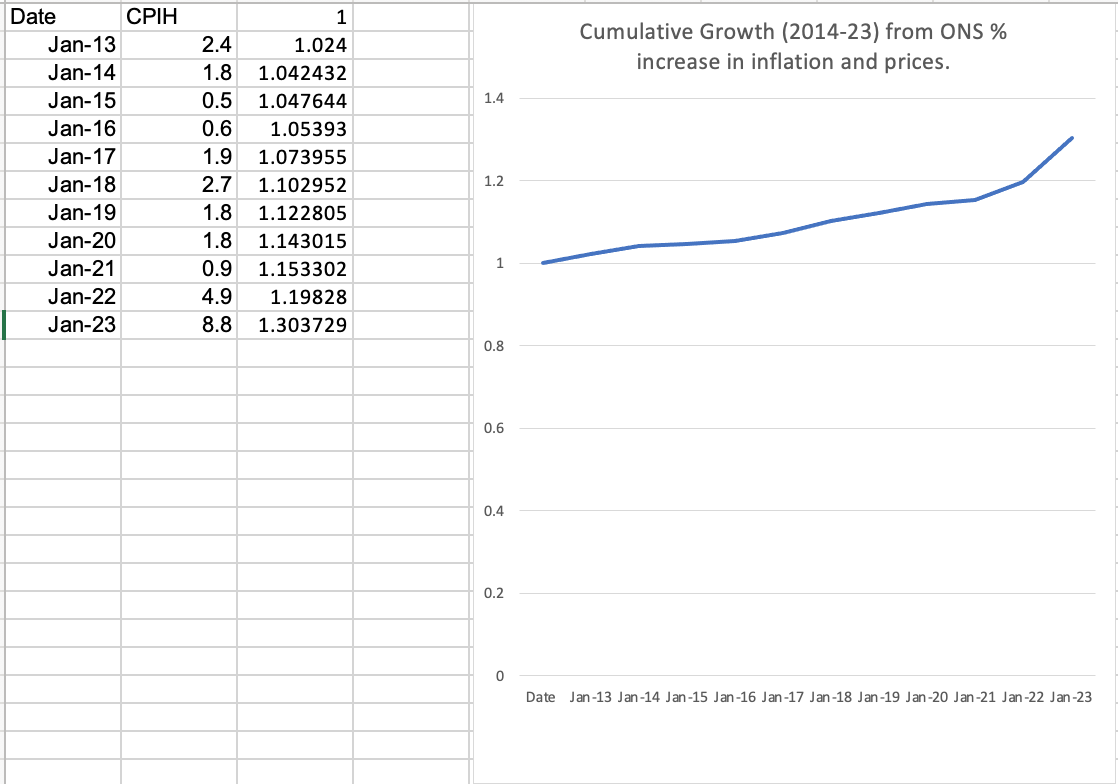
Next I converted the percentage% change data in the government data to cumulative increase (Below) data (assuming jan-2013 is 1), which paints a very different picture of exponential growth.
From there I mapped my percentage% increases in independent stores on top of the government data (Right). I used their data as a starting point for the first recorded year), and forked off with my percentage increases.
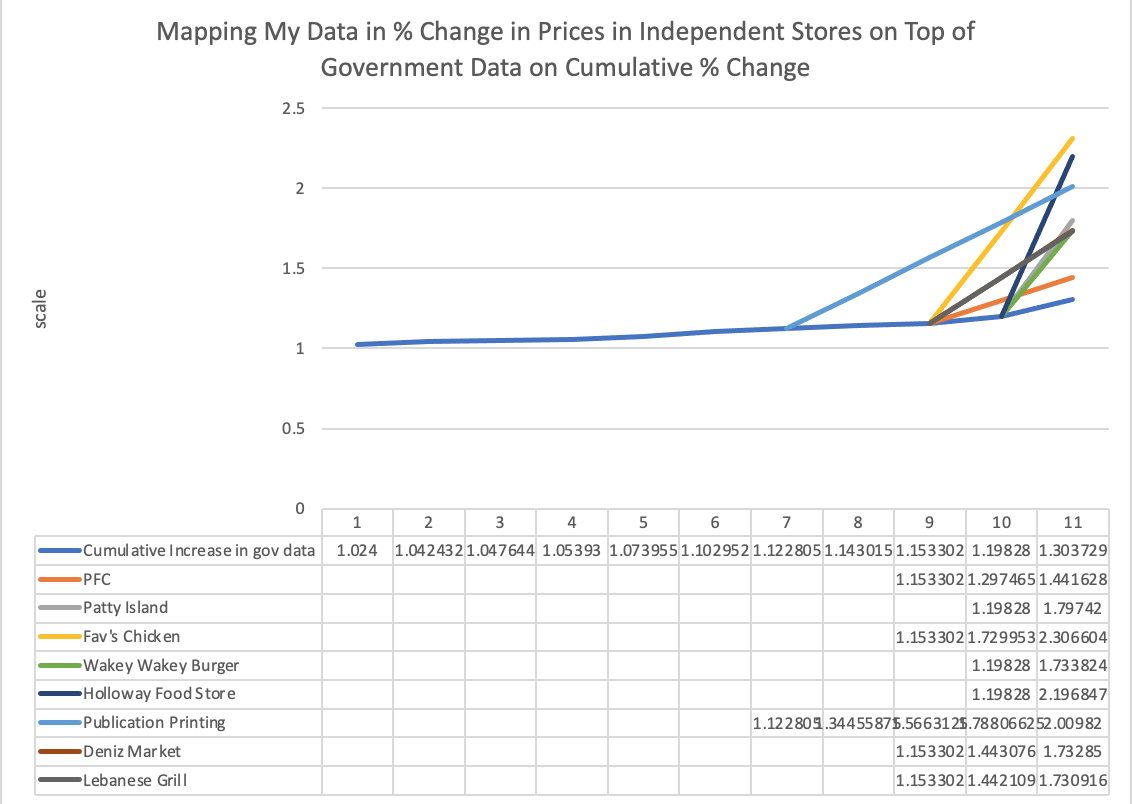
As you can see the results were that the prices in independent stores have increased on a scale larger than what the government data has proposed the Increase of prices to be.
2D Visualisation of My Data:
Here I’ve mapped the data I’ve recorded onto a map (using mapbox). To visually show the rate of increase between different regions of London.
It seems like prices have increased at a larger rate at the outskirts of London compared to central. However I do not have enough data points to conclude any patterns, this probably happened for many reasons such as the stores selling different things instead of a correlation. I need more data to get anything useful out of this, but it’s still interesting.
and that is where this project is at! I've attached all my collected data onto the miro reseach database for you to play around with yourself ☀️